What Is Employee Turnover? Types, Formula, and Costs
Employee turnover is the rate at which people leave an organization and are replaced over a given period. It is one of the most-watched measures in human resources because it is relatively easy to quantify, because it moves with almost everything else that matters (engagement, management quality, pay competitiveness, market conditions), and because high turnover is expensive and disruptive. This page defines the main types of turnover, gives the standard formula with worked examples, puts the numbers in benchmark context, and summarizes what drives turnover, what it costs, and what reduces it.
Turnover, attrition, and churn
These three terms overlap and are often used loosely. In common usage:
- Turnover describes employees leaving roles that the organization then refills. It is the broadest term and the one used in most formal reporting.
- Attrition often describes departures that are not immediately backfilled, such as retirements or roles that are eliminated. Some organizations use it interchangeably with turnover; others reserve it for planned headcount reduction through non-replacement. Our separate reference on attrition rate covers the distinction in more depth.
- Churn is borrowed from customer metrics and used informally for the general rate of loss, most often in fast-moving industries.
Because definitions vary between organizations, the practical rule is to state exactly what is being counted (which separations, over which period, against which headcount) before comparing any two numbers. A surprising share of "our turnover is worse than the benchmark" conversations dissolve once definitions are aligned. For the rest of the vocabulary that shows up in these conversations, from regretted attrition to span of control, see the HR and people analytics glossary.
A brief history of the concept
Turnover is not a new concern. Industrial psychologists and factory managers were studying "labor turnover" in the 1910s and 1920s, when the cost of constantly replacing workers first became a measured management problem rather than an accepted fact of industrial life. The U.S. Bureau of Labor Statistics has published labor turnover data in various forms for roughly a century, and since 2000 its Job Openings and Labor Turnover Survey (JOLTS) has provided the standard monthly picture of hires, quits, layoffs, and total separations across the American economy. Academic research followed a parallel track: March and Simon's 1958 model framed leaving as a function of the perceived desirability and perceived ease of movement, and most later turnover models are elaborations of those two ideas.
The full taxonomy of turnover types
Turnover is usually classified along several independent dimensions, and a single departure sits somewhere on all of them at once.
Voluntary vs involuntary. Voluntary turnover is initiated by the employee: a resignation, whether for another job, a career change, or personal reasons. Involuntary turnover is initiated by the employer: termination for performance or conduct, layoffs, and position eliminations. Most published "quit rates" cover only the voluntary side, which is also the side retention programs can realistically influence.
Functional vs dysfunctional. Functional turnover is the departure of low performers or easily replaced staff; it can be neutral or even beneficial, refreshing the team at modest cost. Dysfunctional turnover is the loss of high performers, scarce skills, and hard-to-fill roles. This is the type most worth preventing, and the distinction is the reason a raw turnover number says little by itself: two companies with identical 15% rates can be in very different health depending on who is inside that 15%.
Avoidable vs unavoidable. Avoidable turnover stems from causes the organization could plausibly have addressed: pay below market, a poor manager, no growth path, chronic overload. Unavoidable turnover stems from causes it could not: relocation for a partner's job, retirement, health, a genuine career change. Exit data sorted this way tells an organization how much of its loss was actually within its control, which is the honest denominator for judging retention efforts.
Internal vs external. Internal turnover is movement between roles inside the same organization: transfers and promotions. It creates a vacancy and a ramp cost in the old team but keeps the person, their context, and their institutional knowledge in the company. External turnover is departure from the organization entirely. Healthy internal mobility is often a substitute for external loss, since employees who cannot move up inside frequently move out instead.
Crossing the first two dimensions produces the most useful management view: a two-by-two matrix of who decided and how much it hurt.
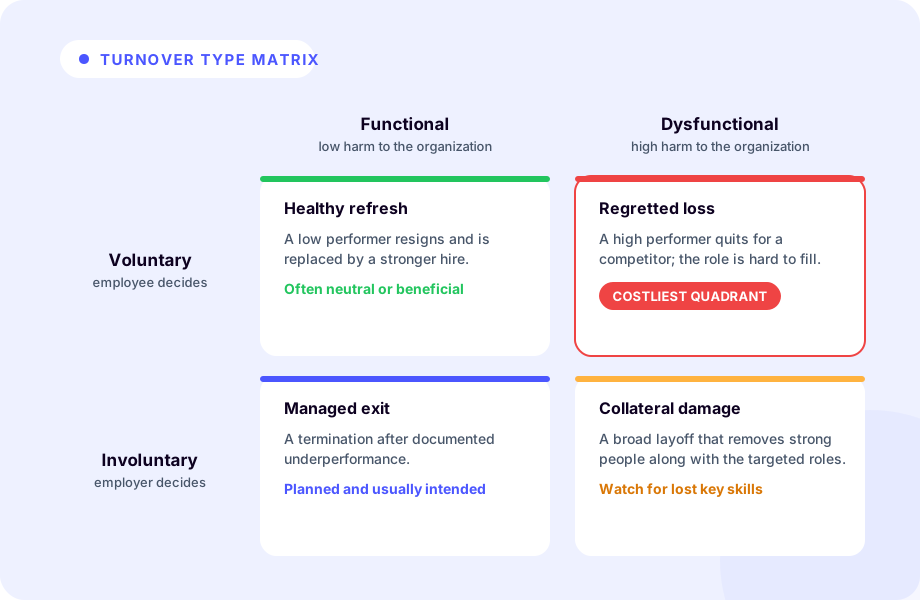
The quadrant that deserves nearly all retention attention is voluntary and dysfunctional: wanted people who chose to leave.
| Functional (low harm) | Dysfunctional (high harm) | |
|---|---|---|
| Voluntary (employee decides) | A low performer resigns; the backfill upgrades the team | A high performer quits for a competitor; hard to fill |
| Involuntary (employer decides) | A managed exit after documented underperformance | A layoff that removes strong people along with targeted roles |
How the turnover rate is calculated
The standard turnover rate for a period is:
(Number of separations during the period ÷ average number of employees during the period) × 100
The average number of employees is usually the headcount at the start of the period plus the headcount at the end, divided by two. Organizations calculate the figure monthly, quarterly, or annually, and typically break it out by department, tenure band, and voluntary versus involuntary so that the number points to a cause rather than just a total. A fuller treatment, including denominator choices, lives in our guide on how to calculate employee turnover rate. To run the formula on your own numbers, the free employee turnover rate calculator takes a starting headcount, an ending headcount and a count of separations, and annualizes a monthly or quarterly result.
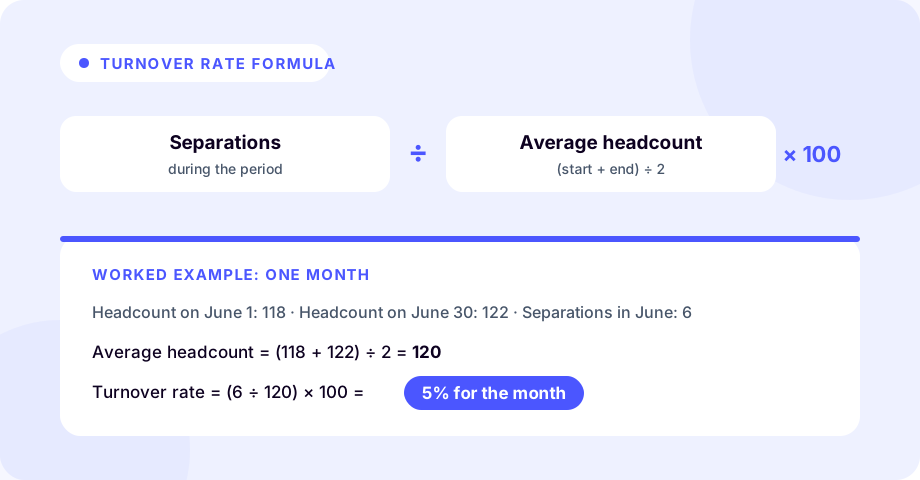
The same formula works for any period; only the window over which separations and headcount are measured changes.
Worked example 1: a monthly rate
A company begins June with 118 employees and ends it with 122. Six people left during the month (four resignations, two terminations).
- Average headcount: (118 + 122) ÷ 2 = 120
- Turnover rate: (6 ÷ 120) × 100 = 5% for June
Note that hires during the month do not enter the numerator; only separations do. The four resignations alone give a voluntary rate of (4 ÷ 120) × 100 = 3.3%.
Worked example 2: an annual rate
A larger company starts the year with 460 employees and ends it with 540 after a year of net growth. Over the twelve months, 85 people left.
- Average headcount: (460 + 540) ÷ 2 = 500
- Turnover rate: (85 ÷ 500) × 100 = 17% for the year
This example illustrates a common point of confusion: a company can grow substantially and still have meaningful turnover. Growth changes the denominator, not the fact of the departures.
Annualizing a monthly rate
To express monthly figures on an annual basis, the standard convention is to sum the twelve monthly rates, or, as an approximation, to multiply a representative monthly rate by 12. The June example above (5%) would annualize to roughly 60% if every month looked like June, which is exactly why annualizing from a single month is dangerous: turnover is seasonal, with resignations commonly clustering after bonus payouts, at the start of the year, and around performance cycles. Annualize from at least a quarter of data, and label the figure as annualized rather than annual so readers know it is an extrapolation.
Benchmarks: what counts as high or low
There is no universal "good" turnover rate, but public data provides useful context. The U.S. Bureau of Labor Statistics publishes monthly separations data through its JOLTS program, and total separation rates for the U.S. economy as a whole have historically run in the mid-40s as a percent of employment annually across all industries, with quits usually making up more than half of that. Industry variation is enormous: accommodation and food services routinely runs several times the all-industry average, while government runs far below it. Professional services, healthcare, and manufacturing sit in between. The full table, with every industry and every year from 2015 to 2025, is on our page for the average turnover rate by industry.
Three practical implications follow. First, cross-industry comparisons are close to meaningless; a 25% rate would be alarming in government and unremarkable in hospitality. Second, the most informative benchmark is an organization's own history: direction and rate of change matter more than the absolute level. Third, because published benchmarks mix voluntary and involuntary separations, an organization comparing itself against them should do the same or note the difference.
Turnover rate vs retention rate
It is tempting to treat retention rate as simply 100 minus the turnover rate, but the two metrics usually measure different populations and are not simple complements.
- Retention rate typically asks: of the people employed on day one of the period, how many are still employed on the last day? New hires made during the period are excluded entirely.
- Turnover rate counts all separations during the period against average headcount, including people who were both hired and gone within the period.
A company that hires 40 people in a year and loses 30 of them within their first six months can post a respectable retention rate (the start-of-year cohort largely stayed) alongside an ugly turnover rate (many separations against average headcount). That exact pattern is a classic signature of an onboarding or hiring-quality problem, and it is invisible to anyone tracking only one of the two numbers. The practical advice is to track both, define both in writing, and never derive one from the other. Our free tool does exactly that: it will calculate the retention rate for a starting cohort and show the matching turnover rate beside it, so you can see for your own period how far apart the two numbers sit.
What drives turnover
Decades of research and practitioner surveys point to a mix of factors rather than a single cause. The drivers group naturally into five categories.
Job factors. The day-to-day content of the work: limited growth or advancement, a role that no longer stretches the person, chronic overload and burnout, or a mismatch between the job as sold and the job as lived. Work Institute's annual Retention Report has repeatedly found career development among the most commonly cited reasons for leaving.
Manager factors. The direct relationship with one's manager: absent feedback, weak recognition, micromanagement, or simple lack of trust. Gallup's research on managers, including its 2015 State of the American Manager report, found that roughly half of surveyed employees had left a job at some point to get away from a manager, and Gallup has long estimated that the manager accounts for a large share of the variance in team engagement.
Organizational factors. Culture, fairness, and stability: pay compression and internal-equity gaps, opaque promotion processes, repeated reorganizations, or a values mismatch. These drivers tend to raise turnover broadly rather than in one team, which is one reason segment-level analysis matters.
Market factors. Conditions outside the building: a hot labor market for particular skills, competitors paying above the organization's band, or remote work widening the set of available employers. Market-driven turnover rises and falls with the economy, visibly so in the JOLTS quits series, where quit rates climb when workers are confident and collapse in downturns.
Personal factors. Relocation, health, family, retirement, a return to school. These are the largely unavoidable causes, and their share of total exits sets a floor under any turnover number. SHRM's practitioner guidance commonly emphasizes separating these from avoidable causes before judging a retention program.
For the specific question of why strong performers leave, see why good employees leave and how to keep them.
The cost of turnover
Replacing an employee carries direct, measurable costs and larger indirect ones. The commonly used breakdown has four parts:
- Separation costs. Exit processing, offboarding administration, accrued-leave payouts, severance where applicable, and the time spent on exit interviews and knowledge handover.
- Replacement costs. Sourcing, job advertising, agency or recruiter fees, interview time across the hiring panel, assessments, and background checks. For senior roles, search fees alone can be a significant fraction of salary.
- Training costs. Orientation, tools and licenses, formal training, and the mentor and manager hours that onboarding consumes.
- Lost productivity and ramp time. Usually the largest and least visible component: the vacant seat producing nothing, colleagues absorbing the overflow, the departing employee's reduced output during their notice period, and the months a new hire needs to reach full productivity. For specialized roles, ramp is commonly measured in quarters, not weeks.
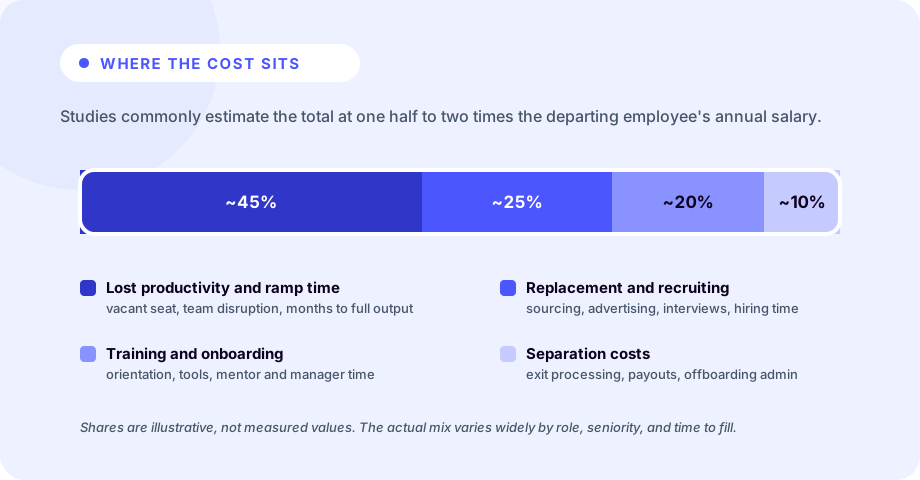
The mix varies by role and seniority, but lost productivity is consistently the largest and least-budgeted component.
Estimates of the total vary widely, and studies commonly express it as a multiple of the departing employee's annual salary. Gallup, in a widely cited 2019 analysis, put the range at one half to two times annual salary, with specialized and senior roles at the higher end. Beyond the countable costs, turnover strains the people who remain: workloads rise, institutional knowledge walks out, and each unaddressed exit of a valued colleague quietly raises the likelihood of the next one. Our dedicated page on the cost of employee turnover works through the arithmetic in detail.
Early warning signs and predictive signals
Resignations tend to look sudden and to have been building for months. The signals that most reliably precede voluntary exits are:
- Engagement decline from a personal baseline. Less initiative, quieter meetings, withdrawal from optional projects and long-term planning. The change matters more than the absolute level.
- Unresolved frustration. Repeated, unaddressed concerns about growth, pay, workload, or the manager relationship. Frustration that gets a response rarely converts to a resignation; frustration that meets silence often does.
- Increased external professional activity. A refreshed public profile, new certifications, expanded networking, and more visible activity on professional platforms such as LinkedIn frequently precede a search.
- Tenure cliffs. Departures cluster around work anniversaries and other natural reassessment points: the first year, the vesting date, the point where the role stops teaching anything new. Plotting exits by tenure almost always reveals a non-uniform distribution with identifiable cliffs.
None of these signals proves anything individually; clusters and changes are what carry information. A fuller catalog appears in signs an employee is about to quit, and the methodology for turning signals into usable lead time is covered in how to predict employee turnover.
Measurement pitfalls
Several common practices make turnover numbers less informative than they appear.
- Averaging across the organization hides hotspots. A stable 12% company-wide rate can conceal one department running at 35% while everything else sits at 8%. Turnover problems are almost always local; the useful view is by team, manager, tenure band, and performance tier.
- Survivor bias in exit data. Exit interviews only sample people who left and chose to answer candidly, and departing employees have little incentive to name a manager they may need for references. Exit data systematically understates manager and culture problems; stay interviews with current employees are the corrective.
- Definition drift. Including or excluding contractors, interns, transfers, or within-period hires changes the number materially. Comparisons across time or across companies are only valid when the definition is held constant.
- Small denominators. On a ten-person team, one departure is a 10% swing. Small-team rates should be read over longer windows or in absolute counts.
- Reading annualized single months as annual truth. As noted above, one month's spike annualized to a headline figure is an extrapolation, not a measurement.
Reducing turnover
Because the causes are varied, effective retention tends to be specific rather than generic: identify which groups are leaving and why, then address the drivers that matter for those groups. The interventions with the strongest practical track record are:
- Stay interviews. Structured conversations with valued current employees regarding what keeps them, what frustrates them, and what would make them consider leaving, followed by visible action. They correct the survivor bias of exit data and create lead time. See stay interview questions for a working format.
- Manager training and accountability. Since the direct manager is a leading driver of both engagement and exits, training managers in feedback, recognition, and career conversations, and holding them accountable for regretted attrition in their teams, targets the largest single lever.
- Proactive compensation reviews. Reviewing pay against market before a competing offer forces the conversation, and fixing internal-equity gaps before they are discovered rather than after.
- Career pathing. Visible next steps, transparent promotion criteria, and genuine internal mobility, so that ambition can be satisfied without a resignation.
- Onboarding quality. First-year turnover is heavily influenced by the first ninety days. Structured onboarding, early manager contact, and honest role previews measurably reduce early exits, which is where the retention-vs-turnover gap described above usually originates.
A broader set of options is collected in employee retention strategies that work, and the surrounding discipline in our overview of employee retention.
References
- "Employee turnover," Wikipedia.
- "Employee retention," Wikipedia.
- "Exit interview," Wikipedia.
- "Job Openings and Labor Turnover Survey (JOLTS)," U.S. Bureau of Labor Statistics.
- "State of the American Manager," Gallup, 2015.
- "This Fixable Problem Costs U.S. Businesses $1 Trillion," Gallup, 2019.
- "Retention Report," Work Institute (annual).
- "Managing for Employee Retention," Society for Human Resource Management (SHRM).
- March, J. G., and Simon, H. A., Organizations, 1958.
This reference page is maintained by TeamPredict, which helps managers spot flight risk and reduce unwanted turnover before it happens.
Frequently asked questions
- What is the difference between turnover and attrition?
- Both describe employees leaving, but attrition usually refers to departures that are not immediately backfilled (for example, retirements or eliminated roles), while turnover refers to departures that create a vacancy the organization intends to fill. Usage varies between organizations, so it is worth confirming the definition before comparing numbers.
- How is the employee turnover rate calculated?
- Divide the number of separations during a period by the average number of employees during that same period, then multiply by 100. Average headcount is usually the headcount at the start of the period plus the headcount at the end, divided by two. For example, 6 departures against an average headcount of 120 is a 5% turnover rate for the period.
- How do you annualize a monthly turnover rate?
- The common convention is to sum the twelve monthly rates, or to multiply a typical monthly rate by 12 as an approximation. A 2% average monthly rate annualizes to roughly 24%. Annualizing a single unusual month is misleading because turnover is seasonal, so it is better to annualize from several months of data.
- What is a good employee turnover rate?
- There is no single good number because rates vary enormously by industry, role, and labor market. Public data from the U.S. Bureau of Labor Statistics JOLTS program shows hospitality and retail running far above average and government far below. The most useful comparisons are against an organization's own history and against close industry peers, not a universal benchmark.
- Are turnover rate and retention rate simple complements?
- No. Retention rate typically tracks how many people employed at the start of a period are still employed at the end, while turnover rate counts all separations during the period, including people who were hired and left within it. Because they use different populations, the two numbers rarely sum to exactly 100%.
- Is all turnover bad?
- No. Involuntary turnover of poor performers, or the departure of employees who are easy to replace, can be neutral or even beneficial. This is called functional turnover. The costliest kind is dysfunctional voluntary turnover: unwanted resignations of high performers and people in hard-to-fill roles.
- What is dysfunctional turnover?
- Dysfunctional turnover is the loss of employees the organization wanted to keep: high performers, people with scarce skills, or holders of critical institutional knowledge. It is the opposite of functional turnover, where the departure causes little harm or even improves the team. Retention effort is best concentrated on preventing the dysfunctional kind.
- How much does employee turnover cost?
- Estimates vary widely by role and seniority. Studies commonly express the cost as a share of the departing employee's annual salary, and Gallup has estimated the range at one half to two times annual salary once recruiting, training, lost productivity, and ramp time are counted. Senior and specialized roles sit at the higher end.
About TeamPredict
TeamPredict Team
We build TeamPredict - retention early-warning software that flags resignation risk from public LinkedIn signals. We write about the patterns that precede a resignation and how people-first teams act on them early. Learn more about TeamPredict
Work out your own turnover rate.
Enter your headcount and departures - the free calculator runs the formula and shows the annualized figure.
Calculate your turnover rateFree, no signup required.