Attrition Rate: What It Means, the Formula, and How to Calculate It
Ask three HR leaders what their attrition rate is and you may get three numbers computed three different ways. That's a problem, because attrition rate is one of the small set of metrics that boards ask for, benchmarks are built on, and retention budgets are justified with. This guide gives you the clean version: what attrition rate actually means, how to calculate it with worked examples, how it differs from turnover rate, what "good" looks like against current national data, how to segment and analyze the number so it actually says something - and, most importantly, what actually brings it down.
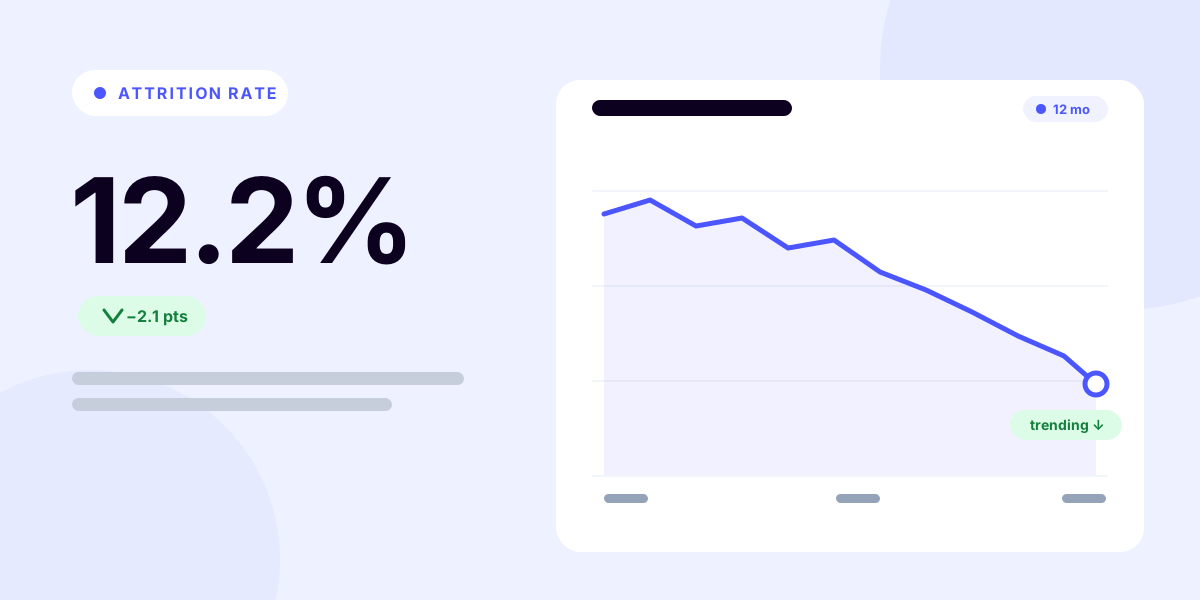
Aim for a falling share of departures you regret, not zero attrition.
What is attrition rate?
Attrition rate is the percentage of employees who leave an organization during a period, relative to the average number of employees in that period. It answers the question: at what pace are we losing people?
The word "attrition" carries a nuance worth knowing. In its traditional HR sense, attrition refers to departures that are not backfilled - the person leaves and the role goes with them, through retirement, restructuring, or a hiring freeze absorbing the vacancy. Turnover, by contrast, describes separations where you intend to refill the seat.
In everyday usage, that distinction has mostly collapsed: many companies, HR tools, and benchmark reports use "attrition rate" and "turnover rate" interchangeably. Neither usage is wrong - but a report that doesn't state its definition is a report you can't compare against anything. Define it once, write the definition next to the number, and keep it consistent.
How to calculate attrition rate
The calculation is the same regardless of which definition you use:
The attrition rate formula
Attrition rate = (departures during the period ÷ average headcount) × 100
Average headcount is usually the simple average of headcount at the start and end of the period:
Average headcount = (headcount at start + headcount at end) ÷ 2
For a full year, averaging your twelve month-end headcounts is more accurate than the two endpoints - especially if you grew or shrank a lot mid-year - but the two-point average is the convention most teams and benchmark reports use.
Three rules keep the number clean and comparable:
- Count people, not events. Someone hired and departed within the same period counts as one departure.
- Use headcount, not FTE, unless you report full-time equivalents consistently everywhere. Mixing the two quietly distorts the result.
- Fix your scope up front. Decide once whether contractors, interns, and seasonal staff are included, and apply that rule every period so your trend stays comparable.
Worked example 1: annual attrition rate
Say you started the year with 100 employees, ended with 96, and 12 people left during the year:
- Average headcount = (100 + 96) ÷ 2 = 98
- Attrition rate = (12 ÷ 98) × 100 = 12.2%
That's the whole calculation: two headcounts, one departure count, one division.
Worked example 2: monthly attrition, and how to annualize it
The same formula works over any window - only the inputs shrink. Take a single month at a larger company:
- Headcount on March 1: 212
- Headcount on March 31: 208
- Departures during March: 4
Then:
- Average headcount = (212 + 208) ÷ 2 = 210
- Monthly attrition rate = (4 ÷ 210) × 100 = 1.9%
To annualize a monthly rate, multiply by 12: 1.9% × 12 ≈ 22.9%. But treat that projection with care - it assumes March repeats itself for a year. If March happened to catch a post-bonus exit wave, the annualized figure badly overstates reality; if it was a quiet month, it understates it.
The more honest annual number is the trailing-12-month rate: total departures over the last twelve months divided by the average headcount across those months. If this company lost 38 people over the trailing year against the same average headcount of 210, its trailing rate is 38 ÷ 210 = 18.1% - noticeably different from the 22.9% a single busy month projected. When a board deck and a monthly dashboard disagree, this is usually why.
Monthly vs. annual attrition
Both views earn their place:
- Monthly attrition is your early-warning gauge. A spike shows up within weeks, while an annual number would dilute it for months.
- Annual attrition smooths seasonal noise (January resignation waves, post-bonus exits) and is the figure most benchmarks and board decks expect.
A practical cadence: track monthly by team, review quarterly with the regretted share broken out, and report the trailing-12-month figure annually.
If you'd rather not push the numbers by hand, the calculator below computes attrition, turnover, and retention rates from the same three inputs - and annualizes monthly or quarterly figures for you. It's the same free turnover & retention rate calculator we host on our tools pages.
Count everyone who left, voluntary and involuntary. For attrition rate, count only the departures you didn't backfill.
Annual turnover rate
12.2%
separations ÷ average headcount (98) × 100
Retention rate
88%
share of the starting headcount that stayed the whole period (assumes all leavers were part of the starting headcount)
Attrition rate vs. turnover rate
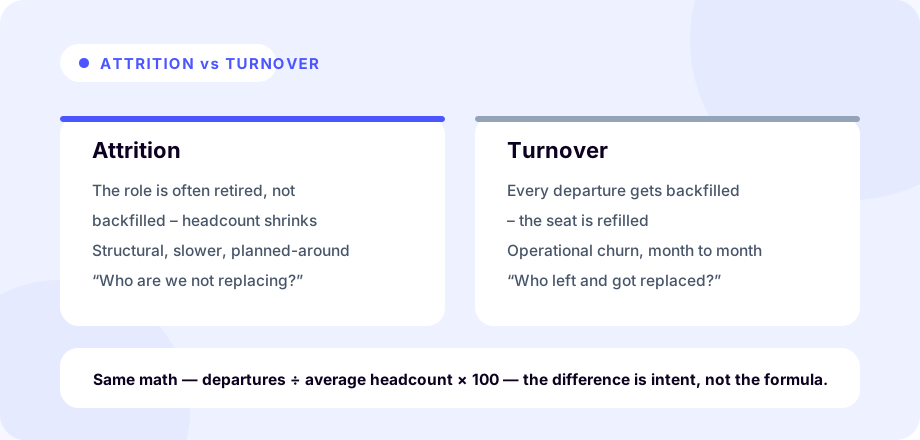
Because this is the most common source of confusion, here's the practical distinction:
| Turnover | Attrition | |
|---|---|---|
| What it counts | Separations you intend to backfill | Departures that permanently reduce headcount |
| Typical drivers | Resignations, terminations | Retirements, eliminated roles, hiring freezes |
| What it signals | Churn and replacement load | Structural shrinkage or drift |
| The formula | Identical | Identical |
The math being identical is exactly why the label matters. A 15% "attrition rate" that's really all-cause turnover tells a very different story from a 15% rate of unreplaced departures. When in doubt, report all separations as turnover and break out the subsets - voluntary vs. involuntary, backfilled vs. not, regretted vs. not - as separate lines. Our guide to how to calculate employee turnover rate covers the edge cases (mid-period hires, averaging choices) that trip up both metrics - and UK teams who use "staff turnover" for the same idea can follow our staff turnover guide.
Retention rate is the same period read from the other end, and it belongs on the same slide. One thing to watch when you report both: people hired during the period can also leave during it, so retention and turnover almost never add up to 100%. Our retention rate calculator asks for starting headcount, hires, and each group's leavers separately, which is what removes that assumption from the arithmetic.
The four types of attrition
Not all attrition means the same thing, and lumping the types together is how companies misread their own data:
- Voluntary attrition - people choose to leave: a new job, a career change, relocation. This is the type you can most influence, and the type where the reasons good employees leave concentrate.
- Involuntary attrition - the company initiates the exit: performance terminations, restructuring. Painful, but managed through different levers entirely.
- Retirement attrition - predictable in aggregate, and a workforce-planning problem more than a retention one. If a wave is coming, succession planning is the response.
- Internal attrition - people leave a team or function without leaving the company. Invisible in the company-wide number, very visible to the manager losing their fifth analyst this year.
The refinement that matters most cuts across all four: regretted vs. non-regretted departures. Losing a struggling performer you'd already flagged is not the same event as losing the senior engineer who anchored half your systems - yet the headline attrition rate scores them identically. Tagging each departure as regretted or not is the single change that makes the metric worth presenting; we cover how in employee retention metrics & KPIs.
Regretted attrition, functional turnover, and the rest of the shorthand these reports lean on each get their own entry in our glossary of turnover and attrition terms, which is useful when a board deck and a dashboard are using the same word for two different things.
What is a good attrition rate?
The honest answer: there is no universal benchmark. Healthy rates differ enormously between industries (retail and hospitality run structurally higher than enterprise software), between geographies, and between role mixes within the same company. Chasing a number from someone else's benchmark report is a good way to solve the wrong problem.
That said, "it depends" shouldn't leave you with no orientation at all. Public national data gives you honest reference points - as long as you read them for what they are.
Average attrition rate benchmarks (U.S. BLS data)
The most reliable public benchmark source is the U.S. Bureau of Labor Statistics' Job Openings and Labor Turnover Survey (JOLTS), which reports separations across the whole U.S. economy every month. In 2025, total separations - quits, layoffs, and all other departures combined - averaged 3.3% of employment per month nationally, and voluntary quits alone averaged 2.0% per month (BLS JOLTS annual average separations rates, annual average quits rates, 2025 annual averages, not seasonally adjusted; accessed July 2026). Because BLS computes those annual averages as the year's separations relative to the year's employment, multiplying by 12 approximates the annual picture: roughly 40% of U.S. employment separated over 2025 across all causes, and about 24% quit voluntarily.
The spread between industries is the more useful part of the data:
| Industry (U.S., 2025) | Total separations, avg per month | Quits, avg per month |
|---|---|---|
| All nonfarm employers | 3.3% | 2.0% |
| Leisure & hospitality | 5.6% | 3.9% |
| Accommodation & food services | 5.5% | 4.2% |
| Professional & business services | 4.6% | 2.3% |
| Retail trade | 3.8% | 2.6% |
| Information | 2.8% | 1.3% |
| Finance & insurance | 2.1% | 1.3% |
| Government | 1.5% | 0.8% |
Source: BLS JOLTS Table 20 and Table 22, 2025 annual averages, not seasonally adjusted. The latest monthly release (May 2026, seasonally adjusted) puts total separations at 3.2% and quits at 1.9% for the month.
Two caveats before you compare your number to that table. First, JOLTS counts every separation event, while most internal HR calculations count people - a seat that churned twice in a year adds two separations to JOLTS. Second, the economy-wide figures are dominated by high-churn hourly sectors, so a knowledge-work company comparing itself to the 3.3% national line is flattering itself; compare against your industry row, or better, against specialized sectors like information (2.8%) and finance (2.1%). An accommodation & food services business running 4% monthly quits is at its industry's norm; an information-sector company at the same level has roughly three times its industry's rate and a serious problem.
Which is the deeper point: benchmarks locate you, they don't diagnose you. Three reads are more useful than any external target:
- Your trend. Is the trailing-12-month rate rising or falling? A climb from 10% to 14% inside a year is a signal regardless of what the industry average says.
- Your segments. A stable company-wide rate can hide one team bleeding out under a struggling manager. Cut the number by team, manager, tenure band, and location before you conclude anything.
- Your regretted share. A 15% rate composed mostly of healthy exits is a different company from a 9% rate concentrated among your best people. The second company has the bigger problem - and the headline rates say otherwise.
And remember that zero attrition is not the goal. No attrition can mean no bar, stalled internal mobility, and compensation drifting above market with no renewal of skills. The goal is a low - ideally falling - regretted attrition rate.
Reading attrition in BPO, IT services, and India
Two contexts reliably sit far above those national averages, and it's worth understanding why before you compare against them. Business process outsourcing (BPO) and contact-centre roles run structurally high attrition almost everywhere: the work is entry-level and high-volume, hiring is designed around backfill, schedules are often rotational or night-shift, and a departed agent is replaced rather than mourned. A rate that would signal a crisis in a product-engineering org is an ordinary operating condition on a support floor.
India's IT-services and BPO sector is the most searched-about version of this. Attrition there tends to run higher than in comparable Western knowledge work for structural, not managerial, reasons: a young, mobile workforce concentrated in a handful of dense tech hubs (Bengaluru, Hyderabad, Pune, the Delhi NCR) where the next employer is a short commute away; intense lateral-hiring competition and counteroffer culture; wage dynamics that make switching the fastest route to a raise; and notice-period and buyout practices that speed the churn along. None of that means the metric is broken - it's the metric working as intended in a hotter labour market.
The reading rules follow from that. JOLTS is a U.S.-only survey, so the table above tells you nothing about India, and published India figures vary so widely by source, sub-sector, and year that no single number deserves to be quoted as the rate - treat any you encounter as illustrative and source-specific rather than a target. So don't benchmark a Bengaluru delivery centre against a U.S. software company, or even a domestic-facing BPO against the IT-services average. Compare like with like - your sub-sector, your city, your tenure band - lean harder on the trailing-12-month view because monthly churn is high enough to swing wildly, and, above all, separate regretted attrition from the expected, designed-in churn these business models simply run on.
What high attrition actually costs
Every unreplaced departure takes institutional knowledge with it, and every backfilled one carries recruiting, onboarding, vacancy time, and months of ramp-up for the replacement. Those costs are mostly invisible on any single line of the P&L, which is why attrition problems persist: the spend is real but diffuse.
Putting a number on it changes the conversation. Our employee turnover cost calculator turns your headcount, average salary, and attrition rate into an annual cost estimate - and, more persuasively, into the savings from cutting the rate by even one or two points. For the full anatomy of where the money goes, see the real cost of employee turnover.
How to segment and report attrition
A single company-wide percentage is where attrition reporting starts, not where it ends. The same 12% can mean "healthy, boring churn" or "our platform team is collapsing" - and only segmentation tells you which. The cuts that consistently earn their place on a report:
- By team and function. The company average is an abstraction; people quit specific teams. A stable 12% overall can hide one function running 30% - and the average will keep hiding it until the function is gone.
- By manager. The most uncomfortable and most useful cut. Roll attrition up to each manager (with a minimum team size - see below) and patterns appear that no engagement survey will volunteer.
- By tenure band. First-year attrition is its own metric with its own causes: it usually indicts hiring, onboarding, or expectation-setting rather than career stagnation. Splitting 0–1 year, 1–3 years, and 3+ years turns one number into three different diagnoses.
- By regretted vs. non-regretted. The refinement that changes decisions. Report the regretted rate alongside the headline rate, every time.
- By voluntary vs. involuntary. A restructuring quarter and a resignation-wave quarter can produce the same headline rate and require opposite responses.
- By location or business unit where it applies - pay-band mismatches and local market pressure show up here first.
Three reporting practices keep the segments honest:
- Respect small denominators. One departure from a five-person team is a 20% attrition rate and means almost nothing. Set a floor (ten or more people is a common convention) below which you report counts, not percentages, and never publish cuts so small that individuals are identifiable.
- State the definition on the report itself. Which separations are counted, over what window, against which headcount average. One line of fine print prevents the quarterly "why doesn't this match finance's number" meeting.
- Keep the format stable. The value of attrition reporting compounds through comparability. A consistent quarterly report with trend lines beats a beautiful one-off analysis every time.
For a board or executive audience, three numbers cover it: the trailing-12-month headline rate, the regretted rate, and the trend of both - with one segment called out if it's driving the movement.
Attrition analysis: finding out where and why
Segmented reporting tells you where attrition concentrates. Attrition analysis is the follow-through: figuring out why, and what to do about it. A lightweight version that most People teams can run without special tooling:
- Establish the baseline. Trailing-12-month attrition, regretted share, and the trend over the past eight quarters. This is the "is it actually getting worse?" check that should precede any intervention.
- Find the concentrations. Cut by the segments above and rank them. Attrition is rarely uniform - in most companies a small number of teams, managers, or tenure bands account for a disproportionate share of regretted exits.
- Read the timing. Cluster the departure dates. Exits that bunch after performance reviews, bonus payouts, or a reorg point at an event; a steady drip points at something structural.
- Pair the numbers with the words. Match the quantitative concentrations against exit-interview themes and stay interview notes from the same segments. A spike plus a recurring theme ("no path past senior," "my manager changed three times") is as close to a root cause as this data gets.
- Watch the leading edge, not just the trailing one. Everything above is history. To change the number rather than narrate it, add forward-looking signals - engagement dips, withdrawal from long-term projects, rising external job-market activity - which is the subject of our guide to predicting employee turnover.
- Close the loop. Attach each intervention to the segment that motivated it and check the segment's rate two, then four quarters later. Retention work earns budget precisely to the degree its effects show up in this loop.
Done quarterly, this analysis takes a day or two and converts the attrition rate from a scoreboard into an agenda.
How to reduce employee attrition
Reducing attrition starts with accepting what the metric can't do: it's a lagging indicator. By the time the rate moves, the people are gone. Everything that works operates earlier in the timeline.
- Find out why people actually leave. Not the polite exit-interview version - the real drivers. Manager relationships, stalled growth, and pay fairness dominate; our breakdown of why good employees leave maps the recurring patterns.
- Invest in the managers. Attrition clusters under specific managers with remarkable consistency. Manager-level attrition data, skip-level conversations, and real management training move the number more than any perk.
- Make growth visible. People rarely quit companies where they can see their next chapter. Career frameworks, internal mobility, and honest development conversations remove the most common reason to look outside.
- Fix pay before it becomes a resignation reason. If your only mechanism for a raise is a resignation letter, you are running a counteroffer program rather than a retention program, and counteroffers mostly delay departures rather than prevent them.
- Run stay interviews before exit interviews. A handful of stay interview questions with your key people surfaces fixable problems while they're still fixable.
- Catch flight risk early. The window to retain someone closes long before the resignation meeting. Leading indicators - disengagement, withdrawal from long-term work, renewed public job-market activity - give you weeks or months of lead time that the attrition rate never will. That early-warning layer is exactly what TeamPredict provides, flagging resignation risk from public LinkedIn signals so you can have the conversation while it can still change the outcome.
Measure it, then get ahead of it
Attrition rate is worth computing correctly: one clean formula, a stated definition, monthly and trailing-annual views, segmented by team, with the regretted share broken out. Do that and you'll describe the past better than most companies do.
But describing the past is the smaller half of the job. The companies that keep their people pair the lagging metric with leading signals - so the next regretted departure shows up as a risk flag with time to act, not as a decimal place in next quarter's rate. Learn how in our guide to predicting employee turnover.
Frequently asked questions
- What does attrition rate mean?
- Attrition rate is the percentage of employees who leave an organization over a period, measured against average headcount. In its strictest sense, attrition refers to departures that are not backfilled - the role is retired along with the person - but many teams use it interchangeably with turnover rate, so it's always worth checking which definition a report is using.
- How do you calculate attrition rate?
- Attrition rate = (number of departures during the period ÷ average headcount during the period) × 100. Average headcount is usually the simple average of your starting and ending headcount. For example, 12 departures in a year against an average headcount of 98 gives an attrition rate of about 12.2%.
- What is the difference between attrition rate and turnover rate?
- The math is identical - departures divided by average headcount. The difference is intent: turnover typically counts all separations you plan to backfill, while attrition traditionally refers to departures that permanently reduce headcount, such as retirements or eliminated roles. In everyday HR usage the terms blur together, so define yours once and use it consistently.
- What is a good attrition rate?
- There is no universal target - healthy rates vary widely by industry, geography, and role mix, and some attrition is genuinely healthy. For rough orientation, U.S. Bureau of Labor Statistics JOLTS data show total separations averaged 3.3% of employment per month in 2025 (roughly 40% annualized, all causes), ranging from 5.6% per month in leisure and hospitality to 1.5% in government. More useful than any benchmark: your own trend over time, how the rate differs across teams and managers, and what share of departures were people you actively wanted to keep.
- Why is attrition rate higher in BPO and IT services in India?
- BPO, contact-centre, and India's IT-services roles run structurally higher attrition than most Western knowledge work, for reasons that are more about the market than about management: entry-level, high-volume roles designed around backfill; rotational or night shifts; and a young, mobile workforce concentrated in dense tech hubs (Bengaluru, Hyderabad, Pune, the Delhi NCR) where the next job is a short commute away, with intense lateral hiring and switching-for-a-raise wage dynamics. Published India figures vary so much by source and sub-sector that no single number is worth quoting as the benchmark, so read these rates in context: compare like-for-like sub-sector and city, lean on the trailing-12-month rate, and separate regretted attrition from the expected churn these models run on.
- How can a company reduce employee attrition?
- Focus on regretted attrition - the leavers you wanted to keep. The levers that consistently matter are manager quality, visible growth paths, fair pay reviews done proactively rather than reactively, and catching flight risk early enough to act. Exit interviews explain attrition after the fact; stay interviews and leading indicators are what actually change it.
About TeamPredict
TeamPredict Team
We build TeamPredict - retention early-warning software that flags resignation risk from public LinkedIn signals. We write about the patterns that precede a resignation and how people-first teams act on them early. Learn more about TeamPredict
What is turnover actually costing you?
Put a number on it in about two minutes with the free turnover cost calculator. No email, no signup.
Calculate your turnover costFree, no signup required.