The 9 Box Grid: A Complete Guide to Talent Reviews
Every talent review runs into the same two questions: who are our best people right now, and who could become far more than they are today? Those aren't the same question, and answering them with a single gut feeling is how good managers make bad calls. The 9 box grid is the tool most companies reach for to separate the two. It's a simple 3x3 matrix that plots each person's current performance against their future potential, giving you nine groups instead of one vague ranking - and a clear next move for each. This guide covers what the 9 box grid is, a template you can rebuild from scratch, what every box means, how to run a fair calibration session, and the honest limits of the tool. To run a review with it, use the 9-box grid template.
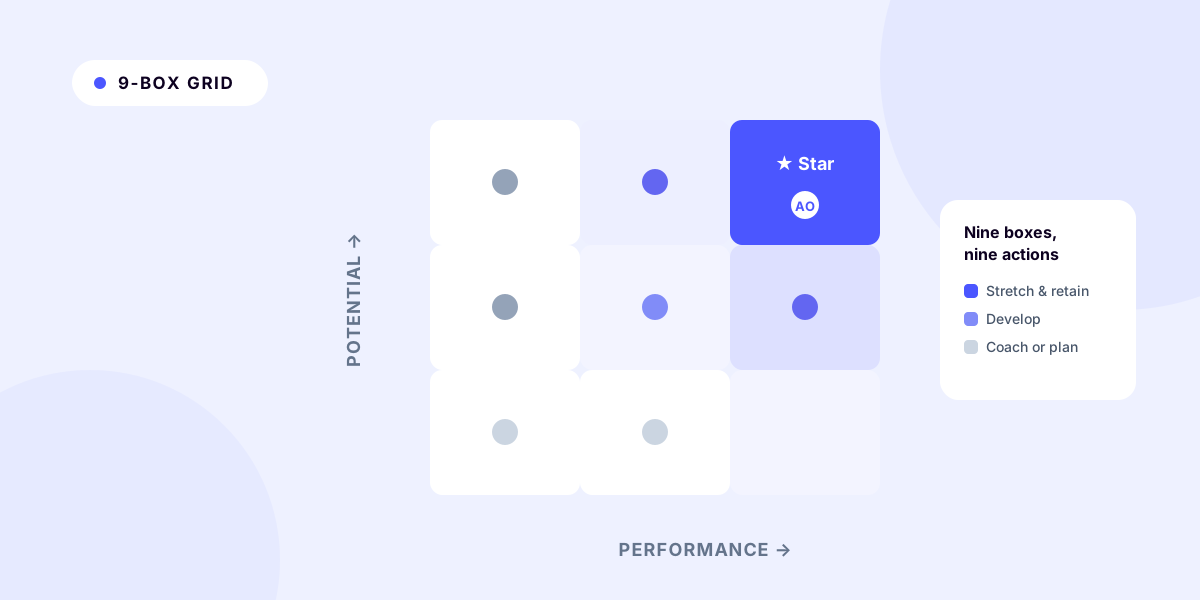
The 9 box grid: performance across the bottom, potential up the side, with your Stars in the top-right box.
What is the 9 box grid?
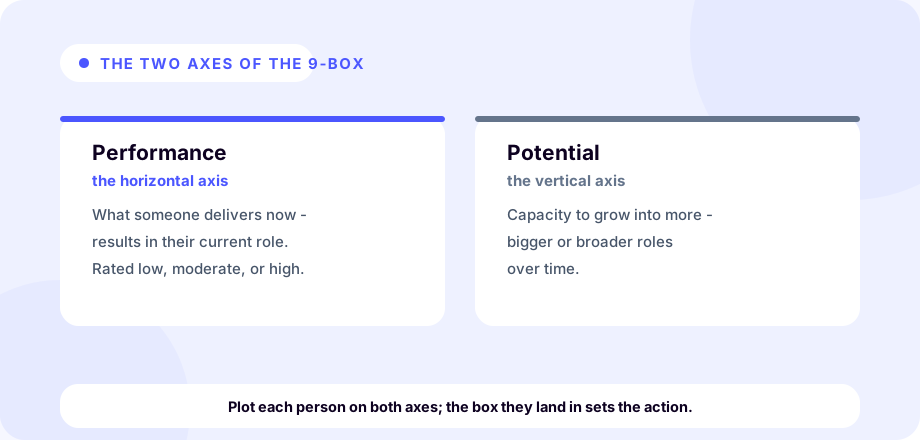
The 9 box grid is a talent-review tool that sorts employees into nine categories based on two things: how well they perform in their current role, and how much potential they have to take on more. It grew out of corporate portfolio strategy decades ago - first as a way to rank business units, later adapted to rate people - and it has stuck around because it does one thing well. It forces a conversation about potential that a standard performance review skips entirely.
Picture a square divided into a 3x3 grid. Performance runs along the bottom (low, moderate, high). Potential runs up the side (low, moderate, high). Every employee lands in one of the nine boxes where those two ratings intersect. That's the whole model. You'll also see it called the performance-potential matrix or a talent map, but the idea is identical. Its power isn't the math - there isn't any - it's that it makes you rate performance and potential separately, then look at the combination.
Performance vs. potential: the two axes
The whole tool depends on rating two different things well, so it's worth being precise about them.
Performance is about results now. It's the most recent one or two review cycles: did this person deliver against their goals, at the expected level, consistently? It's backward-looking and relatively easy to evidence, because you have the outputs in front of you.
Potential is about capacity to grow - specifically, the likelihood that someone could succeed in a bigger or more complex role. It is not the same as ambition, tenure, or being well-liked. It usually shows up as some mix of learning agility, comfort with ambiguity, influence without authority, and appetite for more responsibility. Potential is harder to judge and far easier to get wrong, which is where most of the tool's problems start.
The single most common mistake is treating high performance as proof of high potential. Your best individual contributor is not automatically your next manager. Confusing the two is how organizations promote a brilliant specialist into a leadership role they were never set up to enjoy or succeed in.
The 9 box grid template (build your own)
You don't need software to build a 9 box grid template. A whiteboard, a spreadsheet, or nine sticky-note zones on a wall all work. Here's the layout to recreate:
- Draw a 3x3 square - nine cells in total.
- Label the horizontal axis Performance, increasing left to right: Low, Moderate, High.
- Label the vertical axis Potential, increasing bottom to top: Low, Moderate, High.
- The bottom-left cell is low performance plus low potential. The top-right cell is high performance plus high potential. Everyone else falls somewhere between.
Give each box a short name so the grid is readable at a glance. Naming varies between companies, but a common set looks like this:
| Potential ↓ / Performance → | Low performance | Moderate performance | High performance |
|---|---|---|---|
| High potential | Enigma / Rough Diamond | Growth Employee | Star |
| Moderate potential | Inconsistent Player | Core Player | High Performer |
| Low potential | Underperformer | Effective | Trusted Professional |
Keep the axis definitions written down right next to the grid. If "potential" means something different in every manager's head, the grid is worthless. Shared definitions are what make this a measurement instead of a popularity contest.
What each of the 9 boxes means (and the action for each)
Nine boxes only help if each one points to a decision. Here is what every box tends to represent and what to do about it, strongest to weakest.
-
Star (high performance, high potential). Your top talent and most obvious succession candidates. They deliver now and can clearly go further. Action: stretch them with bigger challenges, give them visibility, and work hardest to retain them - they are the most likely to be recruited away.
-
High Performer (high performance, moderate potential). Excellent in their current role, with some room to grow but perhaps not all the way to the top. Action: reward and deepen their expertise, keep them engaged, and consider lateral stretch rather than assuming a vertical path.
-
Growth Employee (moderate performance, high potential). Not yet delivering at the top level, but the ceiling is high - often people new to a role or under-challenged. Action: invest in development, give them a clear runway, and check that nothing (a bad fit, a weak manager) is capping their output.
-
Trusted Professional (high performance, low potential). Deep, reliable experts who consistently deliver in a role they've mastered and are happy in. Action: value them loudly, retain them in place, and lean on them as mentors. Do not mistake "low potential for a bigger role" for "low value" - these people often hold the business together.
-
Core Player (moderate performance, moderate potential). The dependable middle, usually the largest group in any company and the engine of day-to-day work. Action: keep them engaged and developing. Small investments here move the most people, and ignoring the core because it isn't flashy is a common, costly mistake.
-
Enigma / Rough Diamond (low performance, high potential). High capacity, low output - a mismatch that demands a diagnosis. Are they new, in the wrong role, poorly managed, or disengaged? Action: dig into the cause quickly. A well-placed enigma can become a star; an ignored one leaves.
-
Inconsistent Player (low performance, moderate potential). Flashes of ability without steady delivery. Action: get specific about what "good" looks like, set clear expectations, and coach. This is often a role or motivation problem more than a capability one.
-
Effective (moderate performance, low potential). Steady in their lane, unlikely to grow much beyond it. Action: maintain, keep them productive, and set realistic expectations on both sides.
-
Underperformer (low performance, low potential). Not delivering, with little sign of upside in this role. Action: this is the honest box. Put a clear, time-bound improvement plan in place with real support - and if it doesn't move, a respectful exit or role change is usually kinder than leaving everyone in limbo.
How to run a 9 box grid talent review
A grid built by one manager alone is just that manager's opinions in a nicer format. The value comes from calibration - getting managers in a room to place their people together, challenge each other, and apply a consistent bar. This is the part people mean when they talk about a 9 box grid talent review, or a talent calibration.
A workable process looks like this.
1. Set the definitions first
Before anyone rates anyone, agree what performance and potential mean at your company, with concrete markers. Write them down. This is the single highest-leverage step, because it's what stops "potential" from quietly meaning nine different things.
2. Have managers pre-place their people
Each manager privately positions their own reports on the grid ahead of the session, with a sentence of evidence for each. Pre-work keeps the meeting from turning into cold guesswork and forces people to think before they talk.
3. Calibrate as a group
Walk through people box by box or team by team. The facilitator's job is to pressure-test placements: "What's the evidence for high potential here?" "You called her a star - how does that compare to the person Marcus just called a star?" Cross-manager comparison is where inflated and harsh ratings get pulled back toward a shared bar.
4. Name bias out loud
Recency (one recent win or miss coloring everything), the halo effect (good at one thing, assumed good at all), and affinity bias (rating people who look or think like you as higher-potential) all distort the grid. Saying these out loud in the room gives everyone permission to challenge each other when they creep in.
5. Turn boxes into plans
The grid is worthless if it ends when the meeting does. Every person should leave with a next action: a development step, a stretch assignment, a retention conversation, a documentation task, or an honest performance plan. The boxes are the diagnosis; the plans are the treatment.
6. Revisit on a cadence
People move. A star who gets no new challenge slides toward disengagement; an enigma who gets the right role becomes a star. Re-run the review on a regular rhythm - once or twice a year is typical - rather than treating it as a one-off event.
The honest criticisms of the 9 box grid
The 9 box grid is popular, but it deserves the skepticism it gets. Use it with your eyes open.
-
"Potential" is subjective and easy to bias. There's no clean way to measure potential, so it quietly becomes "who reminds leadership of themselves." Left unchecked, that bakes affinity, gender, and racial bias straight into your talent decisions. Shared definitions and diverse calibration panels reduce this; they don't erase it.
-
It labels people, and labels stick. Once someone is "a core player" or "low potential" in a leader's mind, it colors every later judgment and can become self-fulfilling. People rated low potential get fewer opportunities, so they grow less, which appears to confirm the rating. Treat every box as a snapshot, not a verdict.
-
It's a static picture of a moving target. A grid captures one moment. A new manager, a role change, a life event, or a stretch of burnout can shift someone's performance or potential fast. A grid from last year can be actively misleading.
-
It can demotivate if handled badly. Few debates are hotter than whether to show people their box. Leaked or clumsily shared ratings breed resentment and can push out the very people you meant to keep.
-
It's not a substitute for conversation. The grid tells you nothing about why someone sits where they do, or what they actually want. That only comes from talking to them - in regular one-on-ones, not a spreadsheet.
None of this makes the tool useless. It makes it a starting point for judgment rather than a replacement for it.
Where the 9 box grid fits with retention and succession
For all its flaws, the 9 box grid earns its place when it feeds two things: succession and retention.
On succession, your stars and high-potential employees are your bench. The grid gives you a short, defensible list of who could grow into critical roles, which is exactly the input a lightweight succession plan needs. Pair the grid with a clear read of which roles would hurt most to lose, and you know where to develop people before you need them. Succession planning, span of control, and cohort analysis tend to show up in the same calibration meeting, and our talent and people analytics definitions cover each of them in a sentence or two.
On retention, the grid also quietly ranks your regrettable-loss risk. The people in your top boxes - stars, high performers, growth employees - are the ones the market wants most and the ones whose departure would set you back hardest. Knowing who they are is step one. But a static grid has a blind spot it can't fix on its own: it tells you who you can't afford to lose, not whether any of them is getting restless. Your best people rarely announce that they're wavering, and by the time it shows up in their work, they're often already interviewing. Understanding why good employees leave and watching for early flight-risk signals is what turns the grid from a filing exercise into an early-warning system.
This is the gap TeamPredict is built to close, and it pairs naturally with a 9 box grid. Once the grid tells you who your stars and high-potentials are, it watches for early, public signals of resignation risk - drawn only from publicly available LinkedIn activity, never private monitoring or outreach - and summarizes them into a simple risk level for each person you track. The grid identifies who matters; the signal tells you who might be drifting toward the door while there's still time to have the conversation. The same radar works in reverse, too: pointed at competitors, the signals that warn you a star is restless mark someone at a rival who may be open to a move.
None of this requires enterprise tooling. Build the grid on a whiteboard, calibrate it honestly, turn the boxes into real plans, and revisit them. If you want the early-warning layer on top of it - a person-level read on resignation risk for the stars and high-potentials you can least afford to lose - you can start a free 30-day TeamPredict trial; it takes minutes to set up, and there's no charge until the trial ends. The grid tells you who your best people are. The point is to still have them next year.
Frequently asked questions
- What is the 9 box grid?
- The 9 box grid is a talent-review tool that plots employees on a 3x3 matrix: current performance along one axis and future potential along the other. Each person lands in one of nine boxes, and each box suggests a different action - from stretching your stars to coaching an underperformer. It's used mainly for succession planning, development, and spotting retention risk.
- What do the nine boxes in a 9 box grid mean?
- Each box is a combination of a performance level (low, moderate, high) and a potential level (low, moderate, high). The top-right box - high performance, high potential - is your stars and top succession candidates; the bottom-left is usually an underperformer who needs a clear plan or a role change. The seven boxes in between range from dependable specialists and core players to high-potential people who aren't yet delivering. The names matter less than the action each box implies.
- How do you run a 9 box grid calibration session?
- First agree on written definitions of performance and potential so everyone rates against the same bar. Have each manager pre-place their own people with evidence, then meet as a group to compare and challenge placements, with a facilitator pushing on weak reasoning and cross-manager inconsistency. Name common biases out loud, adjust placements, and turn every box into a concrete action. Revisit the grid once or twice a year, not just once.
- What are the main criticisms of the 9 box grid?
- The biggest is that potential is subjective and easily biased, so the grid can encode affinity, gender, and racial bias if it isn't checked. It also labels people in ways that stick and become self-fulfilling, captures only a single moment in time, and can demotivate staff if ratings are shared carelessly. It works best as a conversation starter and a snapshot, never as a fixed verdict on anyone.
- Should you show employees their 9 box grid rating?
- There's no single right answer, and companies genuinely disagree. Sharing the underlying message - your strengths, your growth areas, where we're investing in you - is almost always useful. Sharing the literal box label often isn't, because low potential lands as a demotion even when it's meant neutrally. Most teams share the forward-looking plan and honest feedback rather than the grid position itself.
About TeamPredict
TeamPredict Team
We build TeamPredict - retention early-warning software that flags resignation risk from public LinkedIn signals. We write about the patterns that precede a resignation and how people-first teams act on them early. Learn more about TeamPredict
Find out who's showing exit signals.
Score one person's flight risk in a couple of minutes with the free assessment - then let TeamPredict watch the rest daily.
Run the free flight-risk assessmentFree, no signup required.